Sources and outputMetric insight
Built by DesignMe, free to use under the MIT licence.
Expert design and dev support for startups and enterprises.
Book a callMetric insight
A number, its trend, and the agent's read on why it moved. Free and MIT licensed, as HTML or a typed React component, in two styles with light and dark mode.
Install
Add it to your project with the CLI.
HTML, CSS and JavaScript
npx designme add metric-insightReact
npx designme add metric-insight --reactThe CLI copies the source into your project, so you own it and can change anything. The HTML version lands in ./designme with the shared core and a demo.html. The React version lands in src/components/designme and needs React 19; it works in Next.js, Vite and Astro.
About
What it is for and what it does.
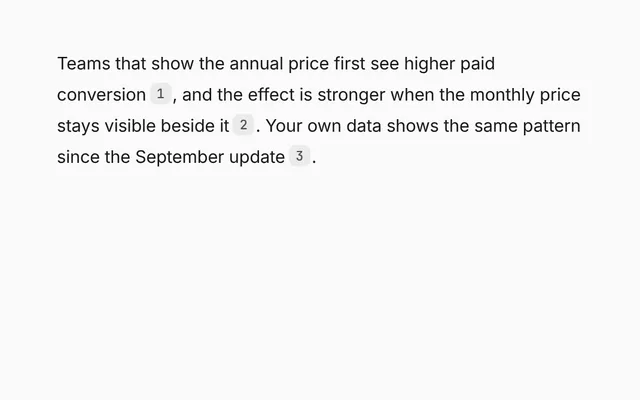
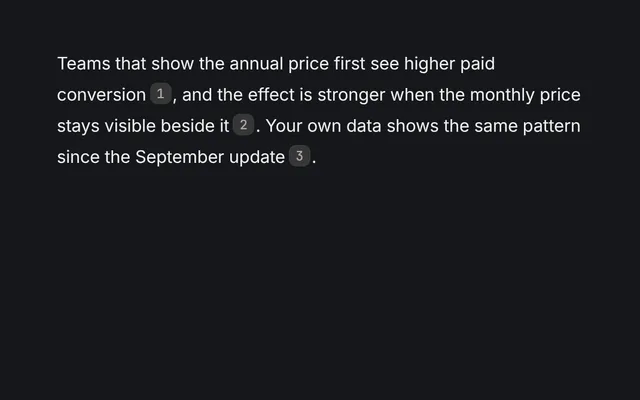
Metric insight shows one number, such as a conversion rate, with its trend line, its change over the chosen range and a one-line note from the agent on what happened. A "Why did it move?" button opens a breakdown of the drivers behind the change.
- When a dashboard should explain a number as well as show it.
- When the agent has found a likely cause, like a release, and you want it marked on the chart.
- When people switch between 7, 30 and 90 day views and expect the story to change with the range.
- When the agent needs a moment to work out the drivers after someone asks.
- Each entry in
rangeshas its ownpoints,value,changeandinsight, and a switch picks between them. - The large number and the change tag roll to their new values. The tag turns red when the change is negative.
- Hovering the chart shows a guide line and a dot on the nearest point, and the large number shows that point's value.
- A range can carry a
marker, such as a release, placed across the chart with its label in a tooltip. - With
drivers, a button opens a list of what moved the number, each with a coloured bar and its share in percent. - Set
explainingwhile you fetch the drivers. The button says "Looking into it" and the breakdown stays shut.formatandformatChangecontrol how numbers read.
- The range switch is a group labelled "Range" whose buttons use
aria-pressed. - The breakdown button has
aria-expanded, and the closed breakdown isinertandaria-hidden. - The chart SVG is
aria-hidden, so the number, change and insight text carry the meaning. - With reduced motion turned on, the number and change jump straight to their values.
Usage
Import it and drive it from your own state.
Import
import { MetricInsight } from '@/components/designme/metric-insight/MetricInsight';Example
The demo above as a React component, 34 lines you can copy.
'use client';
// The animated preview from designme.dev, rebuilt from the React component: switch the range, hover the line, ask why it moved.
import { useEffect, useRef, useState } from 'react';
import { MetricInsight, type MetricDriver, type MetricRange } from './MetricInsight';

const RANGES: MetricRange[] = [
  { key: '7', label: '7d', points: [22.8, 23.1, 22.9, 24.6, 25.4, 25.9, 26.3], value: 26.3, change: 3.5, insight: 'Up all week. Most of the gain came from annual plans.' },
  { key: '30', label: '30d', points: [18.2, 18.5, 18.1, 18.9, 18.4, 18.7, 19.0, 18.6, 19.2, 19.1, 18.8, 19.4, 19.0, 19.3, 19.1, 19.6, 19.2, 21.8, 22.9, 23.4, 23.1, 24.0, 23.6, 24.4, 24.1, 24.9, 25.2, 25.6, 25.9, 26.3],
    value: 26.3, change: 8.1, insight: 'Jumped after the pricing page update on Sep 18.', marker: { at: .58, label: 'Pricing page update shipped' } },
  { key: '90', label: '90d', points: [17.1, 17.6, 17.4, 18.0, 17.8, 18.3, 18.1, 18.6, 18.2, 18.9, 19.4, 22.1, 24.0, 25.5, 26.3], value: 26.3, change: 9.2, insight: 'Flat for two months, then a clear step up in September.' }
];
const DRIVERS: MetricDriver[] = [
  { label: 'Annual plan shown first', percent: 54, color: 'var(--dm-accent)' }, { label: 'One CTA per card', percent: 27, color: 'var(--dm-pl)' },
  { label: 'Seasonal traffic', percent: 12, color: 'var(--dm-pt)' }, { label: 'Unexplained', percent: 7, color: 'var(--dm-faint)' }
];

export default function MetricInsightDemo() {
  const [open, setOpen] = useState(false);
  const [explaining, setExplaining] = useState(false);
  const timer = useRef<ReturnType<typeof setTimeout>>(undefined);
  useEffect(() => () => clearTimeout(timer.current), []);
  // asking takes a moment, the way an agent would look into it
  const toggle = (next: boolean) => {
    if (!next) { setOpen(false); return; }
    setExplaining(true);
    timer.current = setTimeout(() => { setExplaining(false); setOpen(true); }, 900);
  };
  return (
    <div style={{ width: '100%' }}>
      <MetricInsight label="Trial to paid" ranges={RANGES} defaultRange="30" drivers={DRIVERS} explaining={explaining} open={open} onOpenChange={toggle} />
    </div>
  );
}
Props
Everything MetricInsight takes.
| Prop | Type | What it does |
|---|---|---|
labelrequired | string | The metric's name, like "Trial to paid" |
rangesrequired | MetricRange[] | |
range | string | The range on show, by key. Leave it out to let the switch pick it |
defaultRange | string | |
onRangeChange | (key: string) => void | |
format | (value: number) => string | Formats the large number and the hovered point. Defaults to one decimal and a % |
formatChange | (change: number) => string | Formats the change. Defaults to "+8.1 pts" |
drivers | MetricDriver[] | What moved the number, shown under "Why did it move?" |
explaining | boolean | Shows "Looking into it" on the button and keeps the breakdown shut, while you fetch the drivers |
open | boolean | Whether the breakdown is open. Leave it out to let the button toggle it |
defaultOpen | boolean | |
onOpenChange | (open: boolean) => void | |
className | string |
Code
The full source, as the CLI installs it.
MetricInsight.tsxReact · 161 lines
'use client';
import { useRef, useState, type PointerEvent } from 'react';
import { cx } from '../lib/cx';
import { useControllable, useIsoLayoutEffect, useTween } from '../lib/hooks';
import { Icon } from '../lib/icons';
import { enter, Fold, Seg, Swap, Think, Tip } from '../lib/motion';
import '../designme.css';
import './metric-insight.css';

export interface MetricRange {
  /** Identifies the range, like '30' */
  key: string;
  /** The switch label, like "30d" */
  label: string;
  /** The values over the range, oldest first */
  points: number[];
  /** The number in large type, which rolls to it */
  value: number;
  /** The change over the range, in the tag beside it */
  change: number;
  /** One line on what happened, like "Jumped after the pricing page update on Sep 18." */
  insight: string;
  /** A marker on the chart, like a release: `at` is 0 to 1 across, `label` shows on hover */
  marker?: { at: number; label: string };
}

export interface MetricDriver {
  label: string;
  /** Its share of the change, 0 to 100 */
  percent: number;
  /** Any CSS colour, like 'var(--dm-accent)'. Defaults to the accent */
  color?: string;
}

export interface MetricInsightProps {
  /** The metric's name, like "Trial to paid" */
  label: string;
  ranges: MetricRange[];
  /** The range on show, by key. Leave it out to let the switch pick it */
  range?: string;
  defaultRange?: string;
  onRangeChange?: (key: string) => void;
  /** Formats the large number and the hovered point. Defaults to one decimal and a % */
  format?: (value: number) => string;
  /** Formats the change. Defaults to "+8.1 pts" */
  formatChange?: (change: number) => string;
  /** What moved the number, shown under "Why did it move?" */
  drivers?: MetricDriver[];
  /** Shows "Looking into it" on the button and keeps the breakdown shut, while you fetch the drivers */
  explaining?: boolean;
  /** Whether the breakdown is open. Leave it out to let the button toggle it */
  open?: boolean;
  defaultOpen?: boolean;
  onOpenChange?: (open: boolean) => void;
  className?: string;
}

const pct = (v: number) => v.toFixed(1) + '%';
const pts = (v: number) => (v < 0 ? '−' : '+') + Math.abs(v).toFixed(1) + ' pts';
const W = 300, H = 90;

/** A metric with its trend, a one-line explanation, and a breakdown of what moved it. */
export function MetricInsight({ label, ranges, range, defaultRange, onRangeChange, format = pct, formatChange = pts, drivers, explaining = false, open, defaultOpen = false, onOpenChange, className }: MetricInsightProps) {
  const [key, setKey] = useControllable(range, defaultRange ?? ranges[0]?.key ?? '', onRangeChange);
  const [isOpen, setOpen] = useControllable(open, defaultOpen, onOpenChange);
  const r = ranges.find(x => x.key === key) ?? ranges[0];
  const value = useTween(r?.value ?? 0, 900, 0), change = useTween(r?.change ?? 0, 900, 0);
  const [hover, setHover] = useState<{ x: number; y: number; px: number; py: number; v: number } | null>(null);

  // the chart, scaled to 300 by 90 with a point of room above and below
  const d = r?.points ?? [];
  const lo = Math.min(...d) - 1, hi = Math.max(...d) + 1;
  const xy = d.map((v, i) => [d.length > 1 ? i / (d.length - 1) * W : 0, 86 - (v - lo) / (hi - lo) * 80, v] as const);
  const path = xy.map((q, i) => (i ? 'L' : 'M') + q[0].toFixed(1) + ' ' + q[1].toFixed(1)).join(' ');

  // the area and the marker fade in once the metric appears; a range change redraws the line in place
  const chart = useRef<HTMLDivElement>(null);
  useIsoLayoutEffect(() => {
    const el = chart.current; if (!el) return;
    void el.offsetWidth;
    const id = requestAnimationFrame(() => el.classList.add('dm-in'));
    return () => cancelAnimationFrame(id);
  }, []);

  const move = (e: PointerEvent<HTMLDivElement>) => {
    if (!xy.length) return;
    const b = e.currentTarget.getBoundingClientRect(), fx = (e.clientX - b.left) / b.width * W;
    let best = xy[0]; xy.forEach(q => { if (Math.abs(q[0] - fx) < Math.abs(best[0] - fx)) best = q; });
    setHover({ x: best[0], y: best[1], px: best[0] / W * b.width, py: best[1] / H * b.height, v: best[2] });
  };

  // the button changes at once when it starts looking, then crossfades to its next label
  const [looks, setLooks] = useState(0);
  const [wasBusy, setWasBusy] = useState(explaining);
  if (explaining !== wasBusy) { setWasBusy(explaining); if (explaining) setLooks(n => n + 1); }
  const shown = isOpen && !explaining && !!drivers?.length;
  const [opened, setOpened] = useState(0);
  const [wasShown, setWasShown] = useState(shown);
  if (shown !== wasShown) { setWasShown(shown); if (shown) setOpened(n => n + 1); }

  return (
    <div data-dm="" className={cx('dm-mix dm-panel', className)}>
      <div className="dm-mix-h">
        <span className="dm-muted">{label}</span>
        <Seg className="dm-mix-rg" label="Range" value={key} onChange={setKey} options={ranges.map(x => ({ value: x.key, label: x.label }))} />
      </div>
      <div className="dm-mix-v">
        <b className="dm-num dm-mix-n">{format(hover ? hover.v : value)}</b>
        <span className={cx('dm-tag dm-mix-d dm-num', (r?.change ?? 0) < 0 ? 'dm-bad' : 'dm-ok')}>{formatChange(change)}</span>
      </div>
      <div className="dm-mix-ch" ref={chart} onPointerMove={move} onPointerLeave={() => setHover(null)}>
        <svg className="dm-mix-svg" viewBox={`0 0 ${W} ${H}`} preserveAspectRatio="none" aria-hidden="true">
          <defs><linearGradient id="dm-mixg" x1="0" x2="0" y1="0" y2="1"><stop offset="0" stopColor="var(--dm-accent)" stopOpacity=".18" /><stop offset="1" stopColor="var(--dm-accent)" stopOpacity="0" /></linearGradient></defs>
          <path className="dm-mix-a" fill="url(#dm-mixg)" d={path && path + ` L${W} ${H} L0 ${H} Z`} />
          <path className="dm-mix-l" fill="none" stroke="var(--dm-accent)" strokeWidth={2} vectorEffect="non-scaling-stroke" strokeLinejoin="round" d={path} />
          <line className="dm-mix-x" x1={hover?.x ?? 0} x2={hover?.x ?? 0} y1={0} y2={H} stroke="var(--dm-faint)" strokeDasharray="2 3" vectorEffect="non-scaling-stroke" />
        </svg>
        <span className="dm-mix-dot" style={hover ? { left: hover.px, top: hover.py } : undefined} />
        {r?.marker && <Marker key={r.key} at={r.marker.at} label={r.marker.label} />}
      </div>
      <div className="dm-mix-ins"><span className="dm-mix-ic"><Icon name="spark" size="xs" /></span><Swap className="dm-mix-t">{r?.insight ?? ''}</Swap></div>
      {drivers && (
        <button type="button" className="dm-pill dm-soft dm-sm dm-mix-why" aria-expanded={shown} onClick={() => { if (!explaining) setOpen(!isOpen); }}>
          {explaining && <Think />}
          <Swap key={looks}>{explaining ? 'Looking into it' : shown ? 'Hide the breakdown' : 'Why did it move?'}</Swap>
        </button>
      )}
      {drivers && (
        <Fold open={shown} className="dm-mix-box">
          <div className="dm-mix-rs" key={opened}>
            {drivers.map((q, i) => {
              const e = enter(i * 60), c = q.color ?? 'var(--dm-accent)';
              return (
                <div key={q.label + i} className={cx('dm-mix-r', e.className)} style={e.style}>
                  <span className="dm-dot" style={{ color: c }} />
                  <span className="dm-t">{q.label}</span>
                  <span className="dm-bar"><i style={{ width: q.percent + '%', background: c }} /></span>
                  <span className="dm-v dm-num">{q.percent}%</span>
                </div>
              );
            })}
          </div>
        </Fold>
      )}
    </div>
  );
}

/** The marker on the chart. It fades in late, after the line, each time a range that has one comes up */
function Marker({ at, label }: { at: number; label: string }) {
  const ref = useRef<HTMLSpanElement>(null);
  // it renders hidden, then lets the stylesheet take over a frame later, so the delayed fade-in runs
  useIsoLayoutEffect(() => {
    const el = ref.current; if (!el) return;
    void el.offsetWidth;
    const id = requestAnimationFrame(() => { el.style.opacity = ''; el.style.transform = ''; });
    return () => cancelAnimationFrame(id);
  }, []);
  return <Tip label={label}><span ref={ref} className="dm-mix-mk" style={{ left: at * 100 + '%', opacity: 0, transform: 'scale(.5)' }}><Icon name="spark" size="xs" /></span></Tip>;
}
metric-insight.cssReact · 37 lines
/* Generated from designme.dev by scripts/sync.mjs. Edit the site, then sync. */
/* ---------- Metric insight ---------- */
.dm-mix{padding:var(--dm-s-4);display:flex;flex-direction:column;gap:10px}
.dm-mix-h{display:flex;align-items:center;justify-content:space-between;font-size:12.5px}
.dm-mix-rg button{font-size:11.5px;padding:0 var(--dm-s-2);height:24px}
.dm-mix-v{display:flex;align-items:baseline;gap:var(--dm-s-2)}
.dm-mix-v b{font-size:14px;font-weight:500;letter-spacing:-.02em}
.dm-mix-ch{position:relative;height:90px;cursor:crosshair}
.dm-mix-svg{width:100%;height:100%;display:block;overflow:visible}
.dm-mix-l{stroke-dasharray:var(--dm-len);stroke-dashoffset:var(--dm-len);transition:stroke-dashoffset 1.2s var(--dm-ease)}
.dm-mix-ch.dm-in .dm-mix-l{stroke-dashoffset:0}
.dm-mix-a{opacity:0;transition:opacity .8s .5s}
.dm-mix-ch.dm-in .dm-mix-a{opacity:1}
.dm-mix-x{opacity:0;transition:opacity .2s}
@media (hover:hover) and (pointer:fine){.dm-mix-ch:hover .dm-mix-x,.dm-mix-ch:hover .dm-mix-dot{opacity:1}}
.dm-mix-dot{position:absolute;width:9px;height:9px;margin:-4.5px;border-radius:50%;background:var(--dm-surface);box-shadow:0 0 0 2px var(--dm-accent-mark,var(--dm-accent));opacity:0;transition:opacity .2s;pointer-events:none}
/* the change it explains is marked where it happened: a small date label at the top of a dashed guide down through the chart */
.dm-mix-mk{position:absolute;top:-14px;bottom:0;display:flex;flex-direction:column;align-items:center;transform:translateX(-50%);opacity:0;transition:opacity .4s 1.1s;pointer-events:none}
.dm-mix-mk b{pointer-events:auto;display:inline-flex;align-items:center;gap:var(--dm-s-1);height:20px;padding:0 7px;border-radius:var(--dm-r-pill);background:var(--dm-surface);box-shadow:inset 0 0 0 1px color-mix(in srgb,var(--dm-line) 50%,transparent);font-size:11.5px;font-weight:500;color:var(--dm-fg2);white-space:nowrap}
.dm-mix-mk b svg{width:10px;height:10px;color:var(--dm-accent-fg,var(--dm-accent))}
.dm-mix-mk::after{content:"";flex:1;border-left:1px dashed color-mix(in srgb,var(--dm-faint) 50%,transparent)}
.dm-mix-ch.dm-in .dm-mix-mk{opacity:1}
.dm-mix-ins{display:flex;gap:var(--dm-s-2);align-items:flex-start;font-size:13px;line-height:1.5;color:var(--dm-fg2)}
.dm-mix-ic{color:var(--dm-accent-fg,var(--dm-accent));display:grid;margin-top:2px}
.dm-mix-why{align-self:flex-start}
/* a lighter button than the soft pill, like the other quiet asks */
.dm-pill.dm-soft.dm-mix-why{background:var(--dm-chip);box-shadow:none}
.dm-pill.dm-soft.dm-mix-why[aria-expanded="true"]{background:var(--dm-hover)}
@media (hover:hover) and (pointer:fine){.dm-pill.dm-soft.dm-mix-why:hover{background:var(--dm-hover)}}
.dm-mix-rs{display:flex;flex-direction:column;gap:6px;padding-top:2px}
.dm-mix-r{display:flex;align-items:center;gap:10px;font-size:12.5px}
.dm-mix-r .dm-t{flex:1;min-width:0}
.dm-mix-r .dm-bar{width:70px;height:5px;border-radius:3px;background:var(--dm-line);overflow:hidden;flex:none}
.dm-mix-r .dm-bar i{display:block;height:100%;border-radius:3px;transform-origin:left;animation:dm-ssrel .8s var(--dm-ease) both}
.dm-mix-r .dm-v{width:44px;text-align:right;font-size:12px;color:var(--dm-fg2)}
@keyframes dm-ssrel{from{transform:scaleX(0)}}
metric-insight.htmlHTML · 13 lines
<div class="card" data-c="metric-insight">
  <div class="stage-in">
    <div class="mix panel">
      <div class="mix-h"><span class="muted">Trial to paid</span><div class="seg2 mix-rg" role="group" aria-label="Range"><button aria-pressed="false" data-v="7">7d</button><button aria-pressed="true" data-v="30">30d</button><button aria-pressed="false" data-v="90">90d</button></div></div>
      <div class="mix-v"><b class="num mix-n">0%</b><span class="tag ok mix-d num">+0.0 pts</span></div>
      <div class="mix-ch"><svg class="mix-svg" viewBox="0 0 300 90" preserveAspectRatio="none"><defs><linearGradient id="mixg" x1="0" x2="0" y1="0" y2="1"><stop offset="0" stop-color="var(--accent-mark,var(--accent))" stop-opacity=".18"/><stop offset="1" stop-color="var(--accent-mark,var(--accent))" stop-opacity="0"/></linearGradient></defs><path class="mix-a" fill="url(#mixg)"/><path class="mix-l" fill="none" stroke="var(--accent-mark,var(--accent))" stroke-width="2" vector-effect="non-scaling-stroke" stroke-linejoin="round"/><line class="mix-x" y1="0" y2="90" stroke="var(--faint)" stroke-dasharray="2 3" vector-effect="non-scaling-stroke"/></svg><span class="mix-dot"></span><span class="mix-mk" style="left:58%"><b><svg class="i xs"><use href="#i-spark"/></svg>Sep 18</b></span></div>
      <div class="mix-ins"><span class="mix-ic"><svg class="i xs"><use href="#i-spark"/></svg></span><span class="mix-t">Jumped after the pricing page update on Sep 18.</span></div>
      <button class="pill soft sm mix-why">Why did it move?</button>
      <div class="fold shut mix-box"><div><div class="mix-rs"></div></div></div>
    </div>
  </div>
</div>
metric-insight.cssHTML · 36 lines
/* ---------- Metric insight ---------- */
.mix{padding:var(--s-4);display:flex;flex-direction:column;gap:10px}
.mix-h{display:flex;align-items:center;justify-content:space-between;font-size:12.5px}
.mix-rg button{font-size:11.5px;padding:0 var(--s-2);height:24px}
.mix-v{display:flex;align-items:baseline;gap:var(--s-2)}
.mix-v b{font-size:14px;font-weight:500;letter-spacing:-.02em}
.mix-ch{position:relative;height:90px;cursor:crosshair}
.mix-svg{width:100%;height:100%;display:block;overflow:visible}
.mix-l{stroke-dasharray:var(--len);stroke-dashoffset:var(--len);transition:stroke-dashoffset 1.2s var(--ease)}
.mix-ch.in .mix-l{stroke-dashoffset:0}
.mix-a{opacity:0;transition:opacity .8s .5s}
.mix-ch.in .mix-a{opacity:1}
.mix-x{opacity:0;transition:opacity .2s}
@media (hover:hover) and (pointer:fine){.mix-ch:hover .mix-x,.mix-ch:hover .mix-dot{opacity:1}}
.mix-dot{position:absolute;width:9px;height:9px;margin:-4.5px;border-radius:50%;background:var(--surface);box-shadow:0 0 0 2px var(--accent-mark,var(--accent));opacity:0;transition:opacity .2s;pointer-events:none}
/* the change it explains is marked where it happened: a small date label at the top of a dashed guide down through the chart */
.mix-mk{position:absolute;top:-14px;bottom:0;display:flex;flex-direction:column;align-items:center;transform:translateX(-50%);opacity:0;transition:opacity .4s 1.1s;pointer-events:none}
.mix-mk b{pointer-events:auto;display:inline-flex;align-items:center;gap:var(--s-1);height:20px;padding:0 7px;border-radius:var(--r-pill);background:var(--surface);box-shadow:inset 0 0 0 1px color-mix(in srgb,var(--line) 50%,transparent);font-size:11.5px;font-weight:500;color:var(--fg2);white-space:nowrap}
.mix-mk b svg{width:10px;height:10px;color:var(--accent-fg,var(--accent))}
.mix-mk::after{content:"";flex:1;border-left:1px dashed color-mix(in srgb,var(--faint) 50%,transparent)}
.mix-ch.in .mix-mk{opacity:1}
.mix-ins{display:flex;gap:var(--s-2);align-items:flex-start;font-size:13px;line-height:1.5;color:var(--fg2)}
.mix-ic{color:var(--accent-fg,var(--accent));display:grid;margin-top:2px}
.mix-why{align-self:flex-start}
/* a lighter button than the soft pill, like the other quiet asks */
.pill.soft.mix-why{background:var(--chip);box-shadow:none}
.pill.soft.mix-why[aria-expanded="true"]{background:var(--hover)}
@media (hover:hover) and (pointer:fine){.pill.soft.mix-why:hover{background:var(--hover)}}
.mix-rs{display:flex;flex-direction:column;gap:6px;padding-top:2px}
.mix-r{display:flex;align-items:center;gap:10px;font-size:12.5px}
.mix-r .t{flex:1;min-width:0}
.mix-r .bar{width:70px;height:5px;border-radius:3px;background:var(--line);overflow:hidden;flex:none}
.mix-r .bar i{display:block;height:100%;border-radius:3px;transform-origin:left;animation:ssrel .8s var(--ease) both}
.mix-r .v{width:44px;text-align:right;font-size:12px;color:var(--fg2)}
@keyframes ssrel{from{transform:scaleX(0)}}
metric-insight.jsHTML · 42 lines
DM.def('metric-insight', (r, c) => {
  r.innerHTML = r.innerHTML.replace(/\{spark\}/g, I('spark','xs'));
  const D = {
    7:{ d:[22.8,23.1,22.9,24.6,25.4,25.9,26.3], v:26.3, ch:3.5, t:'Up all week. Most of the gain came from annual plans.' },
    30:{ d:[18.2,18.5,18.1,18.9,18.4,18.7,19.0,18.6,19.2,19.1,18.8,19.4,19.0,19.3,19.1,19.6,19.2,21.8,22.9,23.4,23.1,24.0,23.6,24.4,24.1,24.9,25.2,25.6,25.9,26.3], v:26.3, ch:8.1, t:'Jumped after the pricing page update on Sep 18.' },
    90:{ d:[17.1,17.6,17.4,18.0,17.8,18.3,18.1,18.6,18.2,18.9,19.4,22.1,24.0,25.5,26.3], v:26.3, ch:9.2, t:'Flat for two months, then a clear step up in September.' }
  };
  const ch = $('.mix-ch', r), l = $('.mix-l', r), a = $('.mix-a', r), x = $('.mix-x', r), dot = $('.mix-dot', r), n = $('.mix-n', r), dl = $('.mix-d', r), mk = $('.mix-mk', r);
  let pts = [], cur = 30, val = 0, chg = 0;
  function draw(k){
    const d = D[k].d, lo = Math.min(...d) - 1, hi = Math.max(...d) + 1;
    pts = d.map((v, i) => [i / (d.length - 1) * 300, 86 - (v - lo) / (hi - lo) * 80, v]);
    const p = pts.map((q, i) => (i ? 'L' : 'M') + q[0].toFixed(1) + ' ' + q[1].toFixed(1)).join(' ');
    l.setAttribute('d', p); a.setAttribute('d', p + ' L300 90 L0 90 Z');
    // reset to the hidden state without a transition (otherwise it reverses in the same frame and never draws), then draw in
    // the stroke doesn't scale with the stretched chart, so its dashes are measured on screen: use the line's on-screen length
    const sx = ch.clientWidth / 300, sy = ch.clientHeight / 90, len = pts.reduce((t, q, i) => i ? t + Math.hypot((q[0] - pts[i - 1][0]) * sx, (q[1] - pts[i - 1][1]) * sy) : 0, 0);
    [l, a, mk].forEach(e => e.style.transition = 'none'); ch.classList.remove('in'); l.style.strokeDasharray = ''; l.style.setProperty('--len', Math.ceil(len) + 2);
    void ch.offsetWidth; [l, a, mk].forEach(e => e.style.transition = ''); requestAnimationFrame(() => ch.classList.add('in'));
    mk.style.display = k == 30 ? '' : 'none';
    tween(val, D[k].v, 900, v => { val = v; n.textContent = v.toFixed(1) + '%'; });
    tween(chg, D[k].ch, 900, v => { chg = v; dl.textContent = '+' + v.toFixed(1) + ' pts'; });
    swap($('.mix-t', r), D[k].t);
  }
  c.on(ch, 'pointermove', e => { const b = ch.getBoundingClientRect(), fx = (e.clientX - b.left) / b.width * 300; let best = pts[0]; pts.forEach(q => { if (Math.abs(q[0] - fx) < Math.abs(best[0] - fx)) best = q; });
    x.setAttribute('x1', best[0]); x.setAttribute('x2', best[0]); dot.style.left = best[0] / 300 * b.width + 'px'; dot.style.top = best[1] / 90 * b.height + 'px'; n.textContent = best[2].toFixed(1) + '%'; });
  c.on(ch, 'pointerleave', () => n.textContent = D[cur].v.toFixed(1) + '%');
  // once drawn, drop the dashes so a later resize can't cut the line short
  c.on(l, 'transitionend', e => { if (e.propertyName === 'stroke-dashoffset' && ch.classList.contains('in')) l.style.strokeDasharray = 'none'; });
  seg($('.mix-rg', r), v => { cur = +v; draw(cur); });
  $('b', mk).dataset.tip = 'Pricing page update shipped';
  const why = $('.mix-why', r), box = $('.mix-box', r), rs = $('.mix-rs', r);
  why.onclick = () => c.run(async () => {
    if (!box.classList.contains('shut')){ box.classList.add('shut'); why.setAttribute('aria-expanded', 'false'); swap(why, 'Why did it move?'); return; }
    why.innerHTML = '<span class="think on"><i></i><i></i><i></i><i></i></span>Looking into it'; await c.wait(900);
    const R = [['Annual plan shown first', 54, 'var(--accent-mark,var(--accent))'], ['One CTA per card', 27, 'var(--pl)'], ['Seasonal traffic', 12, 'var(--pt)'], ['Unexplained', 7, 'var(--faint)']];
    rs.innerHTML = R.map(q => `<div class="mix-r"><span class="dot" style="color:${q[2]}"></span><span class="t">${q[0]}</span><span class="bar"><i style="width:${q[1]}%;background:${q[2]}"></i></span><span class="v num">${q[1]}%</span></div>`).join('');
    box.classList.remove('shut'); why.setAttribute('aria-expanded', 'true'); stagger($$('.mix-r', rs), 60); swap(why, 'Hide the breakdown');
  });
  c.later(400, () => draw(30));
});
Questions
What people ask about it.
- Can I show something other than a percentage?
- Yes. Pass
formatfor the large number and hovered points, andformatChangefor the tag. The defaults are one decimal with a % and a change like "+8.1 pts". - How do I fetch the drivers only when someone asks?
- Control
openand handleonOpenChange. When it asks to open, setexplainingto true, load the drivers, then setexplainingto false andopento true. The demo does this. - How do I mark a release on the chart?
- Add
marker: { at, label }to a range.atis a position from 0 to 1 across the chart, andlabelshows when the marker is hovered.
More in Sources and output
What the agent read, what it produced and where each answer came from.