Charts and tablesStat cards
Built by DesignMe, free to use under the MIT licence.
Expert design and dev support for startups and enterprises.
Book a callStat cards
Four headline numbers with sparklines and a period switch. Free and MIT licensed, as HTML or a typed React component, in two styles with light and dark mode.
Install
Add it to your project with the CLI.
HTML, CSS and JavaScript
npx designme add stat-cardsReact
npx designme add stat-cards --reactThe CLI copies the source into your project, so you own it and can change anything. The HTML version lands in ./designme with the shared core and a demo.html. The React version lands in src/components/designme and needs React 19; it works in Next.js, Vite and Astro.
About
What it is for and what it does.
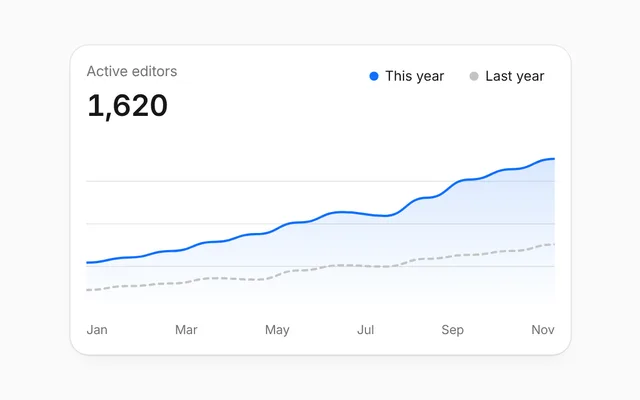
A row of headline numbers, each on its own card with an icon, its change against the period before and a sparkline. A period switch, such as 7 days, 30 days and Quarter, rolls every number and line to the new values at once. It works as the top row of an agent dashboard, for numbers like runs, hours saved and spend.
- At the top of a dashboard, to show the few numbers people check first.
- When you want to show an agent's runs, time saved or cost at a glance.
- When the same numbers need comparing across a few fixed periods.
- Each card shows an icon, a label, a large number that rolls to its value, and a change percentage, green from 0 and red below.
- A sparkline per card draws in from the left, in the card's
coloror the accent colour. - Each stat has one entry in
valuesper entry inperiods, and switching the period updates every card together. - Hovering a card shows the period's
comparetext, like "vs previous 30 days". prefixandsuffixwrap the number, like "$" or "h".sparkRangeputs every sparkline on the same scale; by default each card scales to its own lowest and highest point.
- The period switch is a role="group" labelled "Period", with aria-pressed on the active option.
- Sparklines are aria-hidden SVGs.
- The sparkline draw-in is skipped, and number roll-ups finish at once, when the user prefers reduced motion.
Usage
Import it and drive it from your own state.
Import
import { StatCards } from '@/components/designme/stat-cards/StatCards';Example
The demo above as a React component, 26 lines you can copy.
'use client';
// The animated preview from designme.dev, rebuilt from the React component: the numbers roll up and the switch changes the period.
import { StatCards, type StatCardsPeriod, type StatCardsStat } from './StatCards';

const PERIODS: StatCardsPeriod[] = [
  { label: '7 days', compare: 'vs previous 7 days' },
  { label: '30 days', compare: 'vs previous 30 days' },
  { label: 'Quarter', compare: 'vs last quarter' }
];

// each card has one shape that wobbles a little differently per period, like real weeks do
const wobble = (base: number[], p: number) => base.map((y, k) => y + Math.sin(k * 1.7 + p * 2) * (p ? 1 : .5));
const stat = (icon: StatCardsStat['icon'], label: string, nums: [number, number][], base: number[], extra: Partial<StatCardsStat> = {}): StatCardsStat =>
  ({ icon, label, values: nums.map(([value, change], p) => ({ value, change, points: wobble(base, p) })), ...extra });

const STATS: StatCardsStat[] = [
  stat('spark', 'Agent runs', [[412, 12], [1730, 18], [4980, 22]], [3, 4, 4, 5, 6, 5, 7, 8]),
  stat('users', 'Active editors', [[318, 4], [1130, 9], [1620, 31]], [5, 5, 6, 6, 6, 7, 7, 8]),
  stat('clock', 'Hours saved', [[96, 15], [402, 21], [1180, 26]], [2, 3, 3, 4, 5, 6, 6, 8], { suffix: 'h' }),
  stat('coins', 'Agent spend', [[84, -6], [341, -3], [960, 8]], [6, 5, 6, 5, 4, 4, 4, 3], { prefix: '$', color: 'var(--dm-pt)' })
];

export default function StatCardsDemo() {
  return <div style={{ width: '100%' }}><StatCards stats={STATS} periods={PERIODS} defaultPeriod={1} sparkRange={[0, 8.75]} /></div>;
}
Props
Everything StatCards takes.
| Prop | Type | What it does |
|---|---|---|
statsrequired | StatCardsStat[] | |
periodsrequired | StatCardsPeriod[] | |
period | number | The period on show, by index. Leave it out to let the switch pick it |
defaultPeriod | number | |
onPeriodChange | (period: number) => void | |
sparkRange | [number, number] | The values at the bottom and top of every sparkline. Defaults to each card's own lowest and highest point |
className | string |
Code
The full source, as the CLI installs it.
StatCards.tsxReact · 105 lines
'use client';
import { useEffect, useRef, useState } from 'react';
import { cx } from '../lib/cx';
import { useControllable, useTween } from '../lib/hooks';
import { Icon, type IconName } from '../lib/icons';
import { enter, Seg, Swap, Tip } from '../lib/motion';
import '../designme.css';
import './stat-cards.css';

export interface StatCardsValue {
  /** The number in large type, which rolls to it */
  value: number;
  /** Change against the period before, in percent. Green from 0, red below */
  change: number;
  /** The sparkline, oldest first */
  points: number[];
}

export interface StatCardsStat {
  /** Identifies the card. Defaults to its label */
  key?: string;
  icon: IconName;
  /** Like "Agent runs" */
  label: string;
  /** One entry per period, in the same order as `periods` */
  values: StatCardsValue[];
  /** Before the number, like "$" */
  prefix?: string;
  /** After the number, like "h" */
  suffix?: string;
  /** The sparkline's colour, any CSS colour. Defaults to the accent */
  color?: string;
}

export interface StatCardsPeriod {
  /** The switch label, like "30 days" */
  label: string;
  /** Shown when you hover a card, like "vs previous 30 days" */
  compare?: string;
}

export interface StatCardsProps {
  stats: StatCardsStat[];
  periods: StatCardsPeriod[];
  /** The period on show, by index. Leave it out to let the switch pick it */
  period?: number;
  defaultPeriod?: number;
  onPeriodChange?: (period: number) => void;
  /** The values at the bottom and top of every sparkline. Defaults to each card's own lowest and highest point */
  sparkRange?: [number, number];
  className?: string;
}

const FLAT = 'M0 30 L100 30';

function Card({ stat, index, period, compare, drawn, range }: { stat: StatCardsStat; index: number; period: number; compare?: string; drawn: boolean; range?: [number, number] }) {
  const v = stat.values[Math.min(period, stat.values.length - 1)];
  const shown = useTween(drawn ? v.value : 0, 900, 0);
  const all = stat.values.flatMap(x => x.points);
  const [lo, hi] = range ?? [Math.min(...all), Math.max(...all)];
  const d = v.points.map((y, k) => `${k === 0 ? 'M' : 'L'}${(k / Math.max(1, v.points.length - 1) * 100).toFixed(1)} ${(29 - (y - lo) / (hi - lo || 1) * 28).toFixed(1)}`).join(' ');
  const { className: entering, style } = enter(index * 70);
  // the sparkline draws in from the left as its card arrives
  const spark = useRef<SVGSVGElement>(null);
  useEffect(() => {
    const el = spark.current; if (!el || !el.animate || matchMedia('(prefers-reduced-motion: reduce)').matches) return;
    const a = el.animate([{ clipPath: 'inset(-4px 100% -4px 0)' }, { clipPath: 'inset(-4px 0% -4px 0)' }], { duration: 1000, delay: 300 + index * 70, easing: 'cubic-bezier(.45,0,.2,1)', fill: 'backwards' });
    return () => a.cancel();
  }, []); // eslint-disable-line react-hooks/exhaustive-deps
  const card = (
    <div className={cx('dm-scx-c dm-panel', entering)} style={style}>
      <span className="dm-scx-k"><span className="dm-ic"><Icon name={stat.icon} size="xs" /></span>{stat.label}</span>
      <div className="dm-scx-v">
        <b className="dm-num">{(stat.prefix ?? '') + Math.round(shown).toLocaleString('en-US') + (stat.suffix ?? '')}</b>
        <Swap className={cx('dm-scx-d dm-num', drawn && (v.change >= 0 ? 'dm-up' : 'dm-dn'))}>{drawn ? (v.change >= 0 ? '+' : '') + v.change + '%' : ''}</Swap>
      </div>
      <div className="dm-scx-sp">
        <svg ref={spark} viewBox="0 0 100 30" preserveAspectRatio="none" aria-hidden="true"><path stroke={stat.color ?? 'var(--dm-accent)'} d={drawn ? d : FLAT} /></svg>
      </div>
    </div>
  );
  return <Tip label={compare ?? ''} off={!compare}>{card}</Tip>;
}

/** A row of numbers with their change and a sparkline. Switch the period and they roll to the new values. */
export function StatCards({ stats, periods, period, defaultPeriod = 0, onPeriodChange, sparkRange, className }: StatCardsProps) {
  const [at, setAt] = useControllable(period, defaultPeriod, onPeriodChange);
  // the numbers roll up and the lines draw a moment after the cards come in
  const [drawn, setDrawn] = useState(false);
  useEffect(() => { const t = setTimeout(() => setDrawn(true), 200); return () => clearTimeout(t); }, []);

  return (
    <div data-dm="" className={cx('dm-scx', className)}>
      {periods.length > 1 && (
        <div className="dm-scx-h">
          <Seg className="dm-scx-sg" label="Period" value={String(at)} onChange={v => setAt(+v)} options={periods.map((p, i) => ({ value: String(i), label: p.label }))} />
        </div>
      )}
      <div className="dm-scx-grid">
        {stats.map((s, i) => <Card key={s.key ?? s.label} stat={s} index={i} period={at} compare={periods[at]?.compare} drawn={drawn} range={sparkRange} />)}
      </div>
    </div>
  );
}
stat-cards.cssReact · 20 lines
/* Generated from designme.dev by scripts/sync.mjs. Edit the site, then sync. */
/* ---------- Stat cards ---------- */
.dm-scx{display:flex;flex-direction:column;gap:10px;width:100%}
.dm-scx-h{display:flex;justify-content:flex-end}
.dm-scx-sg button{font-size:12px;height:26px;padding:0 10px}
.dm-scx-grid{display:grid;grid-template-columns:repeat(4,1fr);gap:10px}
@media (max-width:820px){.dm-scx-grid{grid-template-columns:repeat(2,1fr)}}
@media (max-width:420px){.dm-scx-grid{grid-template-columns:1fr}}
.dm-scx-c{padding:var(--dm-s-4);display:flex;flex-direction:column;gap:6px;transition:transform .45s var(--dm-ease),box-shadow .3s;min-width:0}
@media (hover:hover) and (pointer:fine){.dm-scx-c:hover{transform:translateY(-2px);box-shadow:var(--dm-shadow-pop)}}
.dm-scx-k{display:flex;align-items:center;gap:6px;font-size:12.5px;color:var(--dm-muted)}
.dm-scx-k .dm-ic{display:grid;color:var(--dm-fg2)}
.dm-scx-v{display:flex;align-items:baseline;gap:var(--dm-s-2)}
.dm-scx-v b{font-size:14px;font-weight:500;letter-spacing:-.02em}
.dm-scx-d{font-size:12px;font-weight:500}
.dm-scx-d.dm-up{color:var(--dm-ok)}.dm-scx-d.dm-dn{color:var(--dm-bad)}
.dm-scx-sp{height:34px;margin-top:var(--dm-s-1)}
.dm-scx-sp svg{width:100%;height:100%;overflow:visible}
.dm-scx-sp path{fill:none;stroke-width:1.75;vector-effect:non-scaling-stroke;stroke-linejoin:round;transition:d .8s var(--dm-ease)}
stat-cards.htmlHTML · 9 lines
<div class="card wide" data-c="stat-cards">
  <div class="stage-in">
    <div class="scx">
      <div class="scx-h"><div class="seg2 scx-sg" role="group" aria-label="Period"><button aria-pressed="false" data-v="0">7 days</button><button aria-pressed="true" data-v="1">30 days</button><button aria-pressed="false" data-v="2">Quarter</button></div></div>
      <div class="scx-grid"></div>
    </div>
  </div>
</div>
stat-cards.cssHTML · 19 lines
/* ---------- Stat cards ---------- */
.scx{display:flex;flex-direction:column;gap:10px;width:100%}
.scx-h{display:flex;justify-content:flex-end}
.scx-sg button{font-size:12px;height:26px;padding:0 10px}
.scx-grid{display:grid;grid-template-columns:repeat(4,1fr);gap:10px}
@media (max-width:820px){.scx-grid{grid-template-columns:repeat(2,1fr)}}
@media (max-width:420px){.scx-grid{grid-template-columns:1fr}}
.scx-c{padding:var(--s-4);display:flex;flex-direction:column;gap:6px;transition:transform .45s var(--ease),box-shadow .3s;min-width:0}
@media (hover:hover) and (pointer:fine){.scx-c:hover{transform:translateY(-2px);box-shadow:var(--shadow-pop)}}
.scx-k{display:flex;align-items:center;gap:6px;font-size:12.5px;color:var(--muted)}
.scx-k .ic{display:grid;color:var(--fg2)}
.scx-v{display:flex;align-items:baseline;gap:var(--s-2)}
.scx-v b{font-size:14px;font-weight:500;letter-spacing:-.02em}
.scx-d{font-size:12px;font-weight:500}
.scx-d.up{color:var(--ok)}.scx-d.dn{color:var(--bad)}
.scx-sp{height:34px;margin-top:var(--s-1)}
.scx-sp svg{width:100%;height:100%;overflow:visible}
.scx-sp path{fill:none;stroke-width:1.75;vector-effect:non-scaling-stroke;stroke-linejoin:round;transition:d .8s var(--ease)}
stat-cards.jsHTML · 24 lines
DM.def('stat-cards', (r, c) => {
  const S = [
    ['spark','Agent runs',[[412,12],[1730,18],[4980,22]],'',[3,4,4,5,6,5,7,8]],
    ['users','Active editors',[[318,4],[1130,9],[1620,31]],'',[5,5,6,6,6,7,7,8]],
    ['clock','Hours saved',[[96,15],[402,21],[1180,26]],'h',[2,3,3,4,5,6,6,8]],
    ['coins','Agent spend',[[84,-6],[341,-3],[960,8]],'$',[6,5,6,5,4,4,4,3]]
  ];
  const grid = $('.scx-grid', r); let per = 1;
  grid.innerHTML = S.map((s, i) => `<div class="scx-c panel"><span class="scx-k"><span class="ic">${I(s[0],'xs')}</span>${s[1]}</span><div class="scx-v"><b class="num">0</b><span class="scx-d num"></span></div><div class="scx-sp"><svg viewBox="0 0 100 30" preserveAspectRatio="none"><path stroke="${i === 3 ? 'var(--pt)' : 'var(--accent-mark,var(--accent))'}" d="M0 30 L100 30"/></svg></div></div>`).join('');
  const cards = $$('.scx-c', grid), cur = S.map(() => 0);
  const fmt = (s, v) => s[3] === '$' ? '$' + Math.round(v).toLocaleString('en-US') : Math.round(v).toLocaleString('en-US') + s[3];
  function draw(p){
    per = p; cards.forEach((el, i) => { const s = S[i], [val, ch] = s[2][p];
      tween(cur[i], val, 900, v => { cur[i] = v; $('b', el).textContent = fmt(s, v); });
      const d = $('.scx-d', el); d.className = 'scx-d num ' + (ch >= 0 ? 'up' : 'dn'); swap(d, (ch >= 0 ? '+' : '') + ch + '%');
      const pts = s[4].map((y, k) => { const yy = y + Math.sin(k * 1.7 + p * 2) * (p ? 1 : .5); return `${k === 0 ? 'M' : 'L'}${(k / 7 * 100).toFixed(1)} ${(29 - yy * 3.2).toFixed(1)}`; }).join(' ');
      $('path', el).setAttribute('d', pts); el.dataset.tip = ['vs previous 7 days','vs previous 30 days','vs last quarter'][p]; });
  }
  seg($('.scx-sg', r), v => draw(+v));
  stagger(cards, 70);
  c.later(240, () => draw(1));
  if (!REDUCE) cards.forEach((el, i) => $('.scx-sp svg', el).animate([{ clipPath:'inset(-4px 100% -4px 0)' }, { clipPath:'inset(-4px 0% -4px 0)' }], { duration:1000, delay:300 + i * 70, easing:'cubic-bezier(.45,0,.2,1)', fill:'backwards' }));
});
Questions
What people ask about it.
- Can a number show decimals?
- No. The large number is rounded to a whole number and written with thousands separators, like 1,730. Pass a smaller unit, or put the unit in
suffix, if you need finer detail. - How do I compare sparklines across cards?
- Pass
sparkRangeas [bottom, top]. Every card then uses the same scale, so a taller line means a bigger value on every card. - How do I hide the period switch?
- Pass a single entry in
periods, with one value per stat. The switch only shows with two or more periods.
More in Charts and tables
Lightweight charts and tables for dashboards and reports, drawn in plain SVG and HTML.